Transport and Freight Index
August 2021 Transport and Freight Index Report
Release Date: 26 August 2021
Hacking and looting hamper recovery in the Freight Transport sector.
The recent looting and unrest in various parts of South Africa have had a massive impact on the majority of sectors measured by the Ctrack Freight Transport Index.
The Ctrack Freight Transport data shows a split set of data. On a year-on-year basis, the numbers look extremely strong for the sector. However, the quarter ending in July shows the first decline in a year.
The quarterly and yearly data is smoothed, so it is not easy to spot the damage in these numbers, particularly because many sectors, such as Road Freight, were very strong in June. The monthly Ctrack Freight Transport Index paints a clearer picture of the damage done by the looting as well as the downtime of the Transnet computer systems.
The decline between June and July is the steepest decline since April 2020, when level five lockdown restrictions were implemented.
“It was terrible to see all the hard work that business has put into recovering from the effects of COVID-19 lockdown restrictions go up in smoke within a few days,” says Hein Jordt, Managing Director of Ctrack SA.
Chart 1: the Ctrack Freight Transport index.
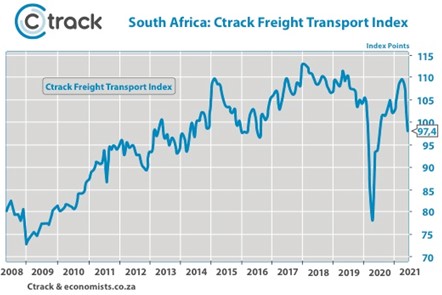
A decline of 9,7% (slightly estimated due to some Transnet Port data not being available in time) between the months of June and July shows that the freight transport sector was severely affected by the looting in KZN and Gauteng.
As a result, the overall Ctrack Freight Transport index declined to levels last seen in August 2020. It is almost as if a whole year of progress was wiped out in a few weeks.
Every day over 6500 containers move in and out of South African ports. There is no way that this operation can run without the sophisticated computer system that is in place.
Modern logistics is a system that is held together by information and computer networks. Hackers know this and were most probably hoping that they would be paid to put things right in the wake of the chaos caused by the downtime of Transnet’s computer systems.
The damage to the South African economy caused by both these events was significant and will be felt for some time. While the crossing of borders is still tedious due to the COVID test requirements, the impact could last longer than normal. The timing of these two incidents, in close succession of each other, could mean that delays at the ports could take weeks, if not months, to resolve.
The country’s GDP could have grown by about 1% if not for these two events, which affected the logistics industry, centred in Kwa-Zulu Natal, but with effects felt in Gauteng, as this is where the majority of the goods were headed.
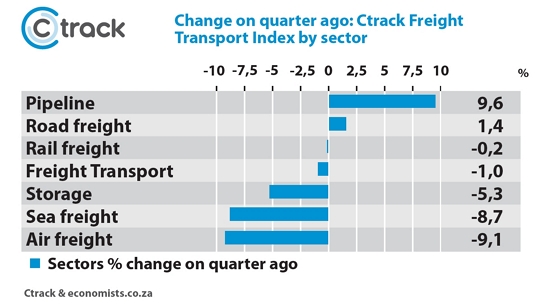
All but one Freight Sector declined.
The majority of sectors measured by the Ctrack Freight Index have declined in recent months. Sea Freight was the biggest loser declining by 24,3%, followed by Storage and Handling with a decline of 16,2%. Even the two fastest-growing sectors, Road Freight and Air Freight, have declined with losses of 9,3% and 3,2% respectively.
The measurement of truck movements through 84 key points across the country backs this data up with a decline of 11,5%. However, points in Kwa-Zulu Natal reported more significant declines of over 20%. Pipelines were the only sector to show growth.
While the catch-up has already started, it will take some time for the backlogs across all sectors to be cleared.
Chart 2: Quarter on Quarter changes with relevance to the trend for July.
Losses are massive for companies, clients, and staff.
The monetary losses and the delays suffered by the Road Freight sector are estimated to be in the region of R9 billion, although some of those losses should be made up in the catch-up period. Transnet ports also lost well over R1 billion. The losses in other sectors are still to be calculated but with ten major distribution centres destroyed while many other storage facilities suffered damage (for analytical reasons, these losses were incorporated into the Road Freight numbers).
The knock-on effects could include rising costs of distribution as the number of distribution centres and warehouses is less, and one can expect higher insurance premiums after this tragic run of events.
Staff costs have also risen, as drivers have to wait for weeks away from home without transporting anything, while trucks not in use mean that the capital cost per load will have to increase. Drivers and crew who could move also felt personal financial losses.
Putting the intense situation into perspective is reports by a single towing company that towed 160 trucks in and around KZN due to looting and destruction. The RFA estimate that about 250 trucks were totally destroyed while many more suffered minor damages such as broken lights and windows.
Clients had to close for days on end, as intermediated stock for manufacturing did not arrive while in some cases shelves stood empty.
The global microchip shortage caused by worldwide supply chain issues was exacerbated by shipments being stuck in the harbours for an additional ten days.
“Ctrack has the technology to make the unpredictable as predictable as possible and have solutions to assist businesses in all sectors to operate as effectively and safely as possible,” said Jordt.
Every cloud has a silver lining, and it was great to see communities and businesses coming together to clean up after the looters, and hopefully, Transnet has learnt that hackers consider them a target too.
“The industry will learn and make adjustments. But it is not something we wish to see again. Two big hits in one year are just too much to bear,” concluded Jordt.

Note: While the figures on Sea Freight are an estimate, we did receive good data on bulk commodities but less so for breakbulk. The majority of estimating is based on TEU and truck movements in the Durban area and on the N3 as a basis for this month's estimate.